
In I still don’t get the fascination with Ruby on Rails, Andy Davidson writes:
Scaling does not mean “Allows you to throw money at the problemâ€, it means “Can deal with workloadâ€. He goes on to recommend mod_perl instead of Rails.
I’m not interested whether he likes Rails or not. Lots of people hate Rails, and I don’t care. I’m not going to make a big deal about the fact that he’s comparing a runtime architecture (Apache + mod_perl) with a framework (Ruby on Rails).
Those are insignificant compared to his claim that scalability means “Can deal with workload”. Actually, that’s a description of capacity.
Scalability is a very distinct concept from capacity. Scalability is not a true/false property of a system; there are degrees of scalability, which can be represented in a 2D graph of # of simultaneous requests that you can service with an acceptable response time (X axis), plotted against the resources required to service those requests (on the Y axis). The function f in the y=f(x) equation that is behind that graph is how scalable your application is.
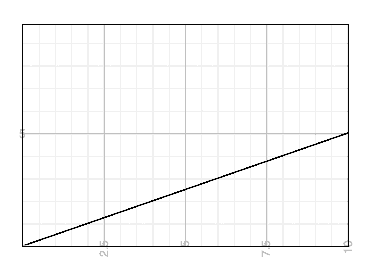
If it’s a straight line, that’s quite good: “linear scalability”. More requests cost the same amount per request as the ones you’re getting now. Double your customers, double your net profits.
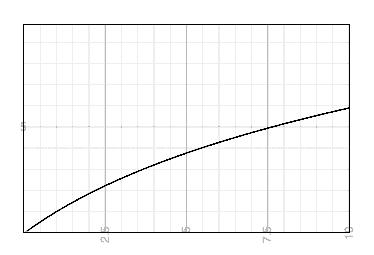
If it curves down away from a straight line, that’s even better than linear scalability: you’ve attained an economy of scale, so twice as many requests costs less than twice as much as the amount you’re paying now.
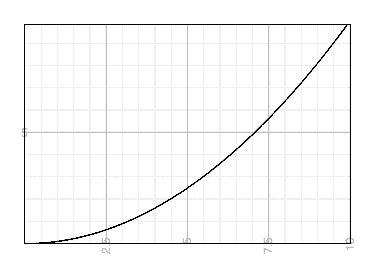
If it curves up away from a straight line, that’s bad, because more load means a greater cost per request. Each new customer makes you less money than the last one. Eventually you will grow to a point where you lose money and your business fails. This is what people are referring to when they say something won’t scale. Linear (or better) scalability curves are what people mean when they say something will scale.
In the worst case, the upward curve is asymptotic to a vertical line. In other words, at some number N of simultaneous requests coming in, you “hit a wall”, and no amount of extra resources will help you. “Allows you to throw money at the problem”, as Mr. Davidson puts it, actually describes all three curves, except for this worst case of curving upward asymptotically. But as long as you don’t hit a wall, “Can deal with workload” is satisfied. The more interesting questions, though, are how much it costs you to add capacity, and whether there’s a certain number of requests above which you start to make or lose money.
Of course, the ideal curves are not what you see in practice. In reality you buy resources in chunks, such as a server or a specific plan of bandwidth, power, and rack space from your colocation provider. The graph looks more like a staircase, and going from N customers to N+1 customers means you have to spend $thousands on new hardware. Each of those chunks represents a certain amount of capacity. Capacity is just a measure of how large each chunk is, or of the largest value of X that your server cluster can support without more resources.
But you can’t just extrapolate from the fact that a single server S will support, say, 100 requests per second, that 100 of them will support 10,000 requests per second. If only it worked that way, capacity planning would be really easy. Sadly, architecting a web application for linear scalability is hard. (It’s doable and the approach is fairly well documented, but it’s not easy.)
I think it’s worth pointing out something now which should be obvious: the slope of a straight line doesn’t change its curvature. If you’re paying a silly amount for each request because you’re using an inefficient architecture that scales linearly, but you’re making an even larger silly amount from your customers, you’re still going to be in business if you have 10x as many customers. You may be leaving money on the table due to inefficient use of resources, but you’re not ruined.
If you’re lucky enough to be in that situation, you can probably hire one or two sysadmin/developer ninjas to optimize your app and change the slope of your line downward. Alternatively, you might decide to increase your profits by just buying more servers and advertising. You could even do both.
Likewise, if you’re losing an average of $5 per customer visit regardless of how many customers you have (with that hard-to-attain linear scalability again), then adding a bunch of servers isn’t going to help you. Sun, Compaq, and Dell sold a ton of server hardware in the late 1990s to companies that didn’t understand this.
In a more realistic scenario, you might be paying a lot for servers but not have much revenue. Improving your application’s efficiency would reduce the cost of your resources somewhat, and you might change from losing money to making money. That’s great, but if your curve bent upward before, it still bends upward, and if you were gonna hit a wall before, you still will. The right decision might be to worry about that later, once you’re profitable. At that time you could afford to change your architecture to scale better. Or, you might choose to invest in the future and focus about scalability improvements and growing your customer base now, losing money now but making piles of cash later when you eventually improve your efficiency.
In conclusion, to tie the two terms together: scalability is a measure of how cost-effectively you can grow (or shrink) your capacity.
And to tie this topic to my ongoing claim that trading runtime language performance for developer productivity is generally a good idea for web apps:
Language performance does not affect whether an application scales or not. It is a coefficient to the cost of capacity.
The cost of capacity affects the slope of your curve, but not the curvature. That’s important. Your architecture and application design are what affect the curvature of your scalability. You need to pay attention to both: the curvature of your scalability function and the cost of capacity will tell you where to invest your developer and sysadmin resources for the best return on investment.
Good thoughts. Any advice on determining my curvature?
>Any advice on determining my curvature?
If you don’t know for certain that it’s linear or better, it’s very likely to be curved upward. Any single points of failure from a high availability standpoint (one DB server, one firewall, etc.) will probably be performance bottlenecks also.
But the graph goes to +infinity on both axes, so it’s not really practical to try and map it all out with the results from your current architecture. Fortunately, as I mentioned near the end of the article, there’s stuff that you can do later to improve scalability, so the whole curve is subject to change shape over time. You’re usually not stuck with the same architecture forever.
For relatively small changes in load (say, 2x-5x), you can approach it like an engineer would. Set a goal for a certain peak load that you’d like to be able to handle, and do synthetic tests (with load generating tools) to make sure that you can get there (plus some margin of safety above that goal) safely. Then put throttling and/or a “high traffic” mode in place if you get vastly more traffic, i.e. if you get Slashdotted/Dugg.
Then you can use the published experiences of other folks to put together a roadmap for getting your own architecture to scale up to the next few big milestones you want to hit (10x, 100x, etc.). That plan will give you estimates on what your curve will look like: buy this and do this work, and we can support 10x as much traffic; buy these and do this additional work and we can grow by another 10x, etc.
The sooner you have such a plan, the sooner you can see what parts of your architecture will need to be replaced in the short term, and so you can hold back on your investments in the things you know you won’t be using for long.
Any advice on determining my curvature?
If you take the right metrics, you can plot a good-enough approximation from your production system. In general, the keys are “measure percent busy, not queue depth” and “measure close”.
For instance: Don’t (just) measure how long it takes for the database to respond to an average query. That includes network, disk, and DB server time, so it’s not “close”. And it will take a lot longer with one request ahead of you than with none, so you’re measuring queue depth, too.
Instead, measure the percent of time your DB server is busy (i.e. the inverse of its idle time). Do the same with its disks, and CPU, and network card.
You’ll pretty quickly see patterns. Think back to shared Ethernet: It doesn’t get 100% utilized, ever. But if you look at what percent of time the network’s available, you’ll see a pretty sharp curve as the utilization goes up. Once you’ve found the knee of the curve, you know what won’t scale.